🖱️ Jump to the contents
1. Yusufeli Dam
2. Complex Foundation Conditions
3. Finite Element Model for Analysis
👉 Case Study Webinar
Yusufeli Dam
Yusufeli Dam is a 275 m high variable thickness double-curvature concrete arch dam (Figure 1) that forms the water impoundment for a 580 MW power station on the Coruh River in Artvin Province, north-eastern Turkey. The scheme is the second largest project forming part of the Coruh River Development Plan.
The dam owner is the DSI (General Directorate of State Hydraulic Works) and was constructed by the Limak between 2012 and 2022. Su-Yapi Engineering and Consulting are the engineers responsible for design work. ARQ Consulting Engineers were consulted as arch dam specialists on the project. The dam structure was completed in May 2021, with controlled impoundment scheduled to commence in early 2022.
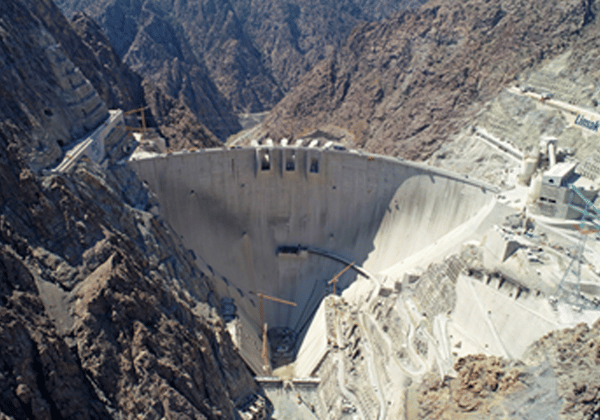 Figure 1. Yusufeli Arch Dam shortly after completion of dam body construction works
The dam has a crest length of 490 m and comprises approximately 4 million m3 of concrete; of which 2,5 million m3 was placed in the arch itself, 700 000 m3 to form the foundation cushions on either flank. 450 000 m3 was placed to form a concrete abutment on the left flank.
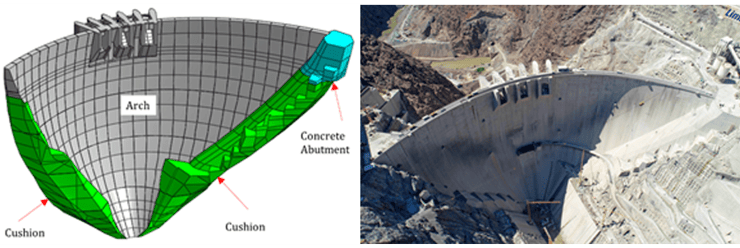 Figure 2. Yusufeli Dam concrete components
The crest-length to height (CL/H) ratio for Yusufeli Dam of 1.78 can be compared with the equivalent data for other existing super-high arch dams, as per Table 1.
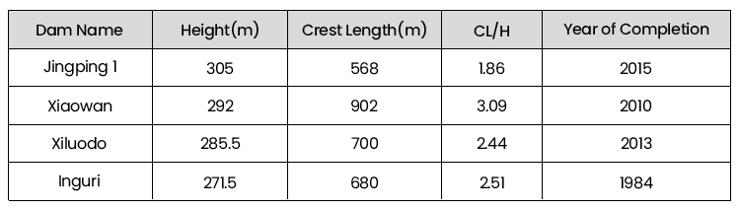 Table 1. Geometric properties of selected super-high arch dams
Complex Foundation Conditions
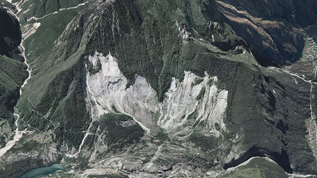
The rock mass foundation of Yusufeli Dam comprises complex layers of rock (Figure 3) exhibiting vertical and horizontal extrusions of material with differing deformation moduli. The Elastic modulus and material strength of the rock mass layers are made up of a broad range of values.
The lower riverbed foundation contains a competent rock. The upper abutment materials are of a lower stiffness due to a certain degree of loss of confinement prior to post-tensioned rock anchors being installed. The rock properties of the left and right banks vary from each other thereby creating an asymmetrical configuration for arch thrust support.
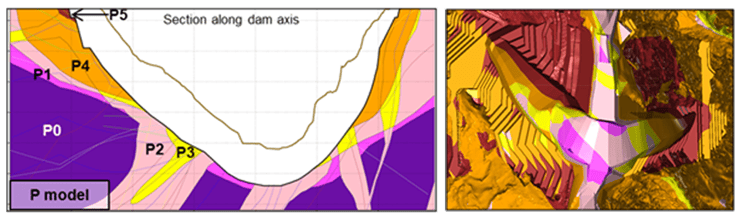
Figure 3. Dam axis section and an aerial view of the complex foundation model
Finite Element Model for Analysis
The dam and foundation FE mesh was created in midas FEA NX and is shown in Figure 4 through Figure 6. The geometry was discretised using the hybrid mesher. The continuum elements used included combination of hexahedral, tetrahedral, pyramid and wedge.
An appropriate meshing strategy was adopted to ensure the model provides good analysis results. This was achieved by using small, regular element sizes with a good aspect ratio to discretise the dam, cushion, and immediate foundation zones.
These zones were expected to develop high strain gradients due to the close proximity of loading. Large element sizes, with less emphasis on aspect ratio, were used to model the outer extents of the foundation model, where small strain gradients were expected to occur. There is a smooth transition in mesh size from the dam to the outer extents.
The lower limit of the foundation continuum model extends to a depth 2 x dam height below the lowest dam foundation. The horizontal outer limits of the foundation model extend to 1.5 x dam height from upper left abutment, upper right abutment, and the most upstream face of the crown cantilever.
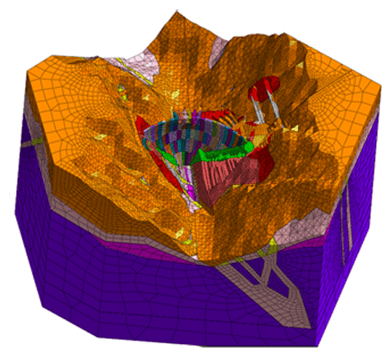
Figure 4. Dam and foundation FE model
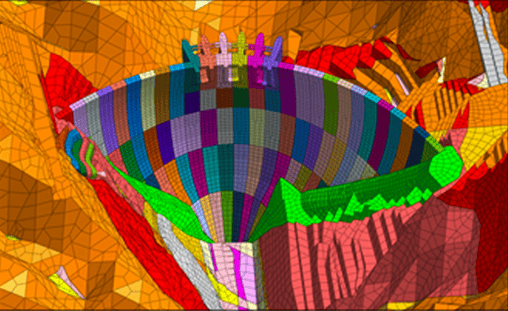
Figure 5. Close-up view of dam and foundation model and dam only
The layered rock mass foundation was modelled as numerous solid geometry bodies interlocking to collectively form the overall foundation continuum. The geometry bodies were developed by slicing a homogeneous body with layer-defining surfaces into the various smaller geometry components.
The layer-defining surfaces were created in AutoCAD from survey investigation data contained in DTM (Digital Terrain Model) files. The DTM files comprised high-resolution surfaces made up of numerous 3d faces. These surfaces were simplified by decreasing the vertices defining the surface. The foundation geometry was defined at the top by the excavation and natural ground level.
The arch dam was modelled using a set of polylines cascading from the crest height down to the foundation level. The curvature of the polylines varies with height and according to the upstream or downstream face of the arch. A solid arch structure was created in AutoCAD by lofting between the polylines defining the arch curvature.
The complex geometry bodies were discretised using the midas FEA NX 3D auto-mesher. The numerous mesh bodies were made to be compatible with each other by using the auto-connect function. This function ensures all touching faces and edges of neighbouring bodies are matched up by imprinting details from one to another at the interface.
The entire set of foundation mesh bodies were fully compatible with each other and the dam, and this was achieved without the need for contact relations between mesh bodies. A top view of the layered foundation mesh showing excavation and NGL (Natural Ground Level) is provided in Figure 6.
It can be seen from Figure 6 that the base of the arch dam structure was founded over foundation layers with differing stiffness parameters. This will cause load transfer from the arch into the foundation to be made up of a complex distribution of thrusts along the dam footprint. Soft foundation zones flanked by stiffer zones may induce bridging action at the base of the dam. The asymmetrical configuration of the foundation layers will also influence the load path transfer through the arch into the foundation.
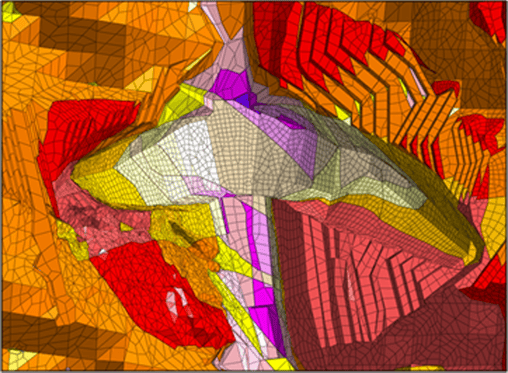
Figure 6. Top view of layered foundation mesh showing excavation and NGL
The complexity of the configuration of foundation layers P1 (fuchsia), P2 (pink), and P3 (yellow) and the interaction between layers are shown in Figure 7. The P3 material shows vertical layers of extruded material indicating typical dike formations from igneous rocks.
The development of a layered foundation model using the FE method in midas FEA NX ensured that the complex load transfer from the dam into the foundation was correctly accounted for in the analysis results.
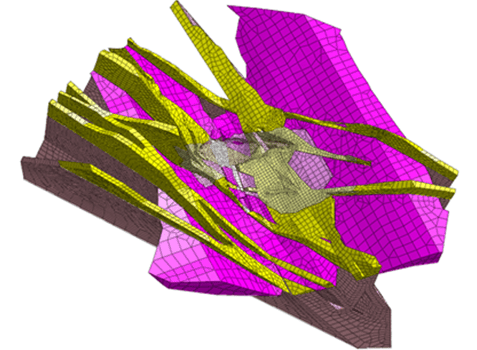
Figure 7. Compexity of foundation layer meshes P1, P2 and P3
Linear elastic material parameters were assigned to the dam and foundation mesh continuum in accordance with the properties provided in the geological and geotechnical reports. The low tensile capacity joints between the dam monoliths and at the dam-foundation contact were modelled using interface elements with a non-linear material model to make provision for low tensile stiffness at these joints.
The FE model was loaded according to the normal operating conditions (usual static loading) as listed in Table 2. The hydrostatic and silt load was applied as pressure to the surface of the mesh. Self-weight was applied as a gravitational body force.
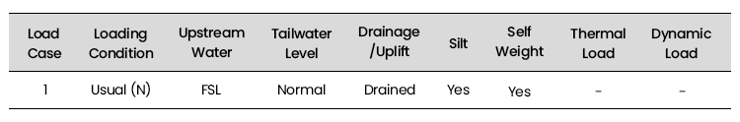
Table 2. Analysis Load Case Definition
The basic load application is illustrated in Figure 7.
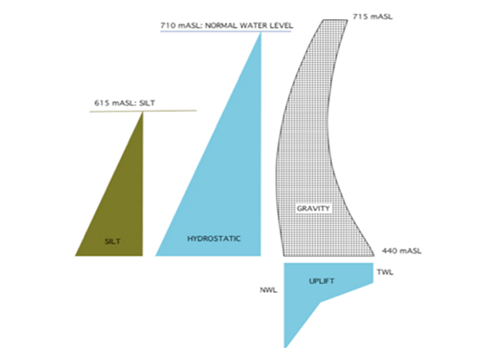
Figure 8. Illustrative Analysis Load Application
The analysis was set to be undertaken using a stage construction approach building the dam body up in 4 steps. The water surface levels for the hydrostatic loading case are indicated in Table 3.
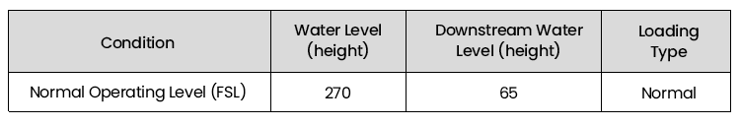
Table 3 . Hydrostatic Loading
Uplift loading was applied across the arch base assuming a drained condition; with full hydrostatic pressure at the upstream face, reducing to an equivalent pressure assuming a drain of 2/3 efficiency at the location of the gallery and reducing further to tailwater (or zero above the tailwater level) at the downstream face.
Analysis Results
Important analysis results to be considered when evaluating the structural integrity of an arch dam include displacements, stresses, and strains. Plots of these results were created using the midas FEA NX results tools.
The displacement results of the dam under normal loading conditions are shown in Figure 9. The maximum radial displacement at the crest of the dam is expected to be approximately 140 mm.
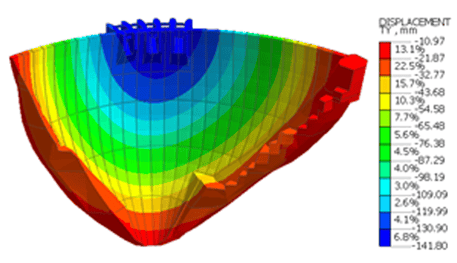 Figure 9. Radial displacement results of dam body
The vertical (cantilever) stress results of the analyses are shown in Figure 10. The analysis results show cantilever action with negligible tensile stress development.
%20stress%20results%20on%20downstream%20and%20upstream%20face%20of%20dam.png?width=740&name=Figure%2010_%20Vertical%20(cantilever)%20stress%20results%20on%20downstream%20and%20upstream%20face%20of%20dam.png)
Figure 10: Vertical (cantilever) stress results on the downstream and upstream face of the dam
Arch stress results of the dam are shown in Figure 11. The dam is shown to be in compression.
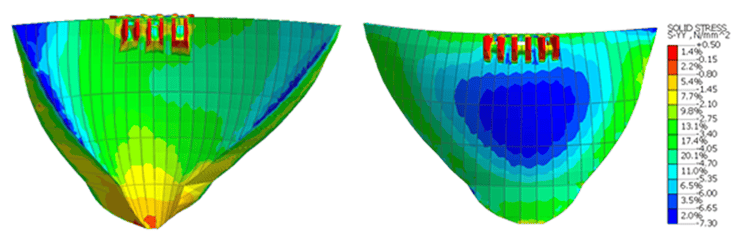
Figure 11. Horizontal stress results on the downstream and upstream face of the dam
The P3 principal stress contour results of the dam (Figure 12) indicate the maximum compressive stress state expected to develop in the dam under loading.
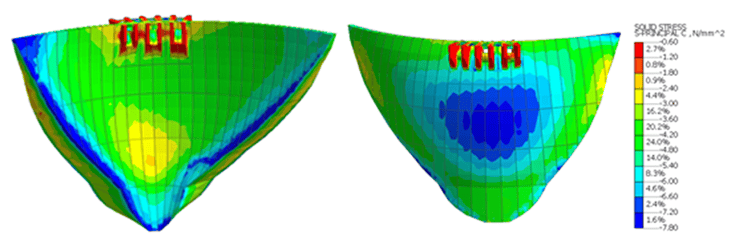
Figure 12. P3 principal stress results on the downstream and upstream face of the dam
P3 principal stress vectors (Figure 13) show the load path through the dam.
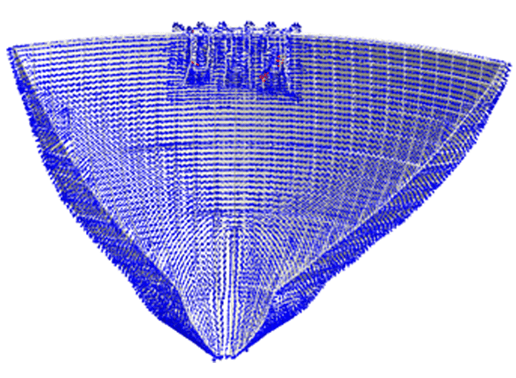
Figure 13. P3 principal stress vector results on the downstream face of the dam
The P1 principal stress contour results of the dam (Figure 13) indicate the maximum tensile stress expected to develop in the dam under loading. It can be seen tensile stresses are negligible in the body of the arch.
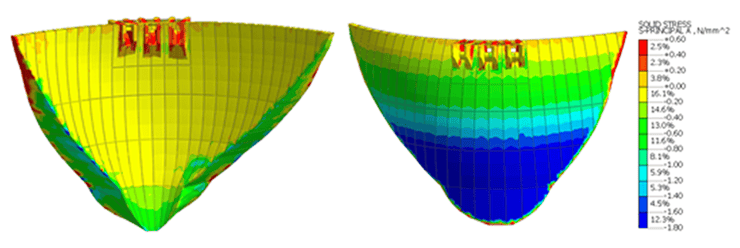
Figure 14. P1 principal stress results on the downstream and upstream face of the dam
A sensitivity analysis was undertaken of the dam for a range of cushion E moduli to evaluate the sensitivity of the structure to changes in the cushion stiffness and to evaluate absolute maximum and minimum stresses that may be expected to occur if the actual E modulus differs from the design value.
Sensitivity curve plots of the analysis displacements of the dam are shown in Figure 16 and Figure 17. These results were extracted from the FE model using the post-processing tools in midas FEA NX.
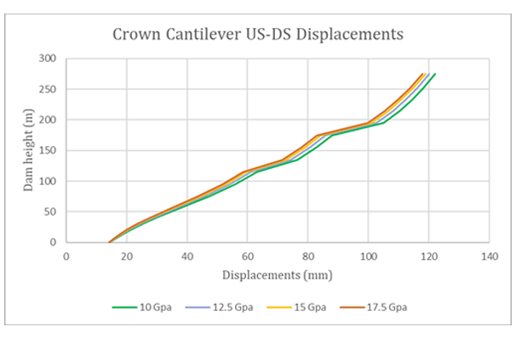
Figure 17. Sensitivity curves of crown cantilever radial displacements for various cushion E moduli
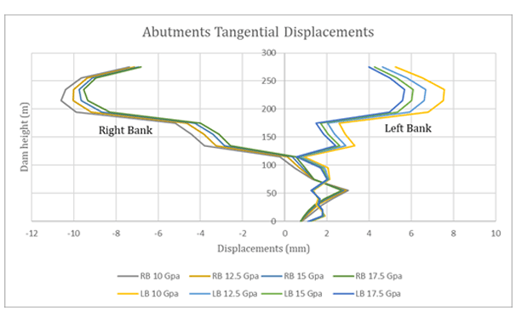
Figure 18. Sensitivity curves of dam abutments tangential displacements for various cushion E moduli
Conclusion
The design of a concrete arch dam on a layered rock foundation is a complex task that requires careful consideration of the foundation conditions. The on-site conditions need to be suitably represented in the finite element model.
Using midas FEA NX, we were to accurately simulate the varying stiffnesses of the layered foundation. This allowed for the correct representation of the stress flow from the dam body and cushion into the surrounding foundation. This provides a significant degree of confidence in the final design calculations.
.png?width=737&name=bio_Ryan%20Cassells(2).png)
👉 Case Study Webinar